Conference Proceedings, International Association for Energy Economics International Conference, Stockholm 2011
Abstract
This paper attempts to test the the variability of wholesale electricity prices in the spot market. I use a simple distributed lag econometric model and and daily data from Denmark, which is one of the few places with a long history of signifcant wind power penetration. I show that wind power has the effect of reducing intra-day variability but that this result only partially carries over to price variation over weekly time windows. I suggest that the reduction in price variability in turn is due to a steeper supply schedule at peak-load times
Executive Summary
Overview
Wind power is playing an increasingly important role in electricity systems around the world with countries from Great Britain to China planning on massive amounts of investment in the coming decade. The special nature of wind power - negligible marginal costs and an intermittent and variable energy profile - implies that the installation of large amounts of wind energy has the potential to affect the functioning of the electricity system as a whole. Yet the effect that substantial wind capacity has on market-based electricity systems, where prices provide the main mechanism for maintaining a balance of supply and demand is poorly understood in theory, and little researched in practice.
Due to the early and heavy investment by Denmark, the Nordic electricity market is one of the few places with a relatively long history with significant amounts of wind power. The Nordic system is also a market-based system with decentralized producers making bids in the wholesale market on a central exchange. Prices are the main tool to resolve transmission constraints and balance the system across regions and countries. These attributes make the Nordic market ideal for studying the effects of wind power. While other researchers have focused primarily on the effect of wind power on price level, I focus on measures of price variability, and argue that this is an important indicator of how efficiently the electricity system is operating.
Methods
In this paper I apply time-series regressions to an extensive dataset of hourly and daily data points from the Danish Transmission System Operator (Energinet), Nordpool - the central exchange, as well as other relevant data sources. My identifying assumption is that wind power is a passive energy source with marginal costs close to zero. Wind power can thus be seen to be exogenous as producers have no incentive to adjust production based on price signals.
I run three sets of regressions each with several different specifications. I first focus on measures of intraday price volatility – running separate regressions for the effects on the system-wide spot prices as well as the local area prices (Denmark east and west). In these regressions I must take into account the strong seasonality and serial correlation of power market data. I then proceed to run regressions where prices are aggregated to daily averages and volatility is evaluated over weekly and monthly time-periods.
Results
The analysis gives a nuanced view of the effects of wind power on price variability. When looking at the variability of prices per hour over the course of a day, wind power tends to have the effect of reducing variability. The effect was significant, both statistically and economically, for the system wide spot price with an estimated elasticity of between -.026 and -.035. The effect on the Danish area prices tended to be even higher. The elasticity for Denmark east was estimated to be between -.067 and -.070 and Denmark west to be between -.081 and -.087.
However, when I aggregate to daily units and look at variability over weekly and monthly periods, wind power has the effect of increasing variability, and more so in the monthly time-window. For example, the estimated elasticity of wind power on weekly price variability in Denmark west was estimated to be .165 while monthly volatility was estimated to be .200. Wind power, in other words, seems to be accounting for a significant part of the weekly and monthly price volatility in Denmark.
Conclusions
Lower intraday volatility but higher longer-term volatility has implications for investment and system operation. Given that the lower intraday volatility is due to lower average prices at peak times, this could have adverse effects on investment in peaking generation. Since the expected payoff of such generation that is only used at peak times is now lower, less may be built. Thus, though wind power may have the effect of on average reducing intraday variability, in the long term this could lead to more instances of extreme stress and high price spikes when wind is not blowing at peak times.
The increased volatility at longer time-windows reflects the investment challenges of installing large amounts of intermittent generation. Consumption has been relatively flat in Denmark over the course of the last two decades. Therefore the added wind power has tended to replace older thermal generation (mostly coal plants). These plants are mothballed but often still operational and in times of stress, such as the winter of 2002-2003, they can be activated. In markets where generation must be built to meet growing consumption, substantial backup generation is needed.
The increased price volatility caused by wind power also has interesting implications for the hydro-power producers that dominate the Nordic market. The Econ Pøyry groups simulation study for Sweden indicated that the value of water would drop, and thus the profitability of these plants would decrease with increased wind power. Yet given enough transfer capacity, the increased volatility presents an opportunity for hydro power producers with reservoirs as they can arbitrage the increased price differentials at the same time providing a measure of stability in the system by acting as a “battery”.
The Energy Journal, Vol. 34, No. 1. 2013
It is well established within both the economics and power system engineering literature that hydropower can act as a complement to large amounts of intermittent energy. In particular hydropower can act as a “battery” where large amounts of wind power are installed. In this paper I use simple distributed lag models with data from Denmark and Norway. I find that increased wind power in Denmark causes increased marginal exports to Norway and that this effect is larger during periods of net exports when it is difficult to displace local production. Increased wind power can also be shown to slightly reduce prices in southern Norway in the short-run. Finally, I estimate that as much as 40 percent of wind power produced in Denmark is stored in Norwegian hydropower magazines.
Executive Summary
Danish wind power a success because of neighbors’ hydro
It is well established in both the economics and engineering literature that hydro power can serve as a backup or battery to large amounts of wind power. Hydro power can quickly and cheaply adjust its production level while storing energy in the form of water in its storage magazines. This paper shows the extent to which this interaction takes place in a market based system where transmission capacity between the wind power area and the hydro power area is limited. I use data from Denmark, which has a large amount of wind power and Norway, which produces nearly all its electricity from hydro power. Transmission constraints cause wind power to push down prices much more in Denmark than in Norway. Yet during periods where wind power cannot easily replace local production, 30 to 40 percent of wind power is estimated to be exported and stored in Norwegian hydro power magazines. While added transmission capacity would likely increase this interaction, this must be weighed against the considerable cost of such investments.
Power systems need to ensure that electricity production always meets consumption. The installation of large amounts of wind power where output is volatile must then be offset by plants that can quickly and cheaply adjust their output, such as hydro power. Hydro power plants also have the advantage of being able to store energy in the form of water in reservoirs. Therefore a reduction in hydro power production due to increased wind power production can be seen as the storage of wind energy. However, wind power is often not located in the same geographical area as hydro power and it is not clear to what extent a market based system provides the right incentives for this cross-border interaction to occur. In this paper I estimate the extent to which Danish wind power and Norwegian hydro power are able to interact. Both countries are integrated in the Nordic electricity market and Denmark has a high share of wind power and essentially no hydro power capacity. Norway on the other hand is dominated by hydro power.
Wind does not easily replace local production on cold days
During certain periods it is difficult for wind power to displace local production. In Denmark, nearly 60 percent of the thermal power plants - coal, biomass, etc. - are combined heat and power plants that provide district heating to homes and businesses. During cold periods, these plants cannot easily be shut off and increased wind production should optimally lead to increased exports to Norway. In such periods, I estimate that between 30 and 40 percent of Danish wind power production is exported to Norway and stored in Norwegian hydro power magazines through reduced hydro power production.
Transmission constraints and prices are important
Both Denmark and Norway are part of the Nordic electricity market and most of the interaction between wind power and hydro power is arranged through market mechanisms. Increased wind power will push down prices which in turn will signal hydro power producers in Norway to reduce production and allow for increased imports from Denmark. However,transmission capacity between the two countries is limited. Therefore, increased wind power will tend to reduce prices more in Denmark than in Norway. I estimate that a doubling of wind power will on average reduce prices by between 3 and 5 percent in Denmark but only by .5 percent in Norway. Adding more transmission capacity will reduce this price difference and lead to a higher incentive for hydro power producers to reduce their production in response to increased wind power. However, transmission cables and other infrastructure are expensive and the benefits of more interaction must be weighed against these costs.
The Decision to Scrap a Wind Turbine: Policy changes, scrapping incentives and why windturbines in good locations get scrapped first
The Energy Journal, Vol. 35, No. 2. 2014
Data
R Code
Abstract
The most common reason for scrapping a wind turbine in Denmark is to make room for a newer turbine. The decision to scrap a wind turbine is then highly dependent on an opportunity cost that comes from the interaction of scarce land resources, technological change and changes in subsidy policy. Using a Cox regression model I show that turbines that are located in areas with better wind resources are at a higher risk of being scrapped. Policies put in place in order to encourage the scrapping of older, poorly placed turbines actually have a larger effect on well- placed turbines.
Executive Summary
Previous studies have shown that only a minority of wind turbines get scrapped because of mechanical defect or wear. In this way, wind turbines are more like computers than cars – turbines are usually scrapped in order to make room for newer, larger, more technologically advanced models. The lifetime of a turbine is then not primarily a function of mechanical quality but is dependent on a combination of technological change, subsidy policy and the wind resources of a turbine’s location. The research has implications for the designing and implementation of wind power subsidies.
A data set consisting of all wind turbines constructed in Denmark from 1972 through July of 2012 is used in the study. I show that the timing of scrapping is strongly affected by changes in wind power subsidy policy as well as by policies meant to encourage the scrapping of older turbines. The key finding is that turbines located in better, windier locations get scrapped first.
Reductions in subsidy cause scrappings
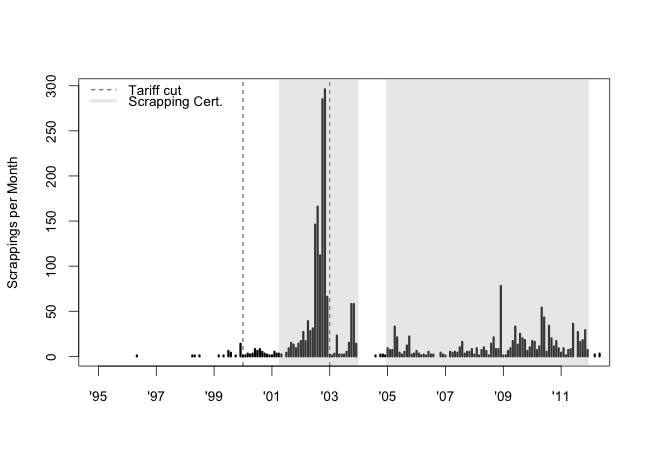
Reductions in wind power subsidies have led to jumps in the number of scrappings as the figure below shows. The reason is that turbine owners receive subsidies for a defined lifetime of their turbine based on when they were installed. When a reduction in subsidies was announced, owners rushed to install new, larger turbines before the lower subsidy policy took effect. Because zoning and preparing new land for turbines take time, many wind power producers instead scrapped older turbines to make room for the newer turbines.
In the figure the dotted vertical lines represent times when subsidies were lowered and the jumps in scrappings are visible before the policy changes at the beginning of 2000 and especially 2003. The shaded region shows periods in which a subsidy was available for owners who scrapped older, smaller turbines. These policies are also shown to have been highly effective.
Turbines in good locations get scrapped first
The main result of the research is to show that as turbine owners rushed to install new turbines before the production subsidy was lowered or to take advantage of the scrapping subsidy, they tended to scrap turbines located in better, windier locations first. This is because in the face of technological change that has led to the ability to make larger more productive turbines over time, older turbines located in windier locations represent a higher opportunity cost.
The findings have implications for the designing and timing of wind power subsidies. The research suggests, for example, that if the goal of policy is to maximize the amount of wind power, changes in policy should be announced well in advance so that producers have time to prepare new land for the installation of a new turbine rather than scrapping an old one.
Now or Later? Trading wind power closer to real-time and how poorly designed subsides lead to higher balancing costs
The Energy Journal, Vol. 36, No. 4
Data
R-Code:
Code for analysis
Abstract
The most important challenge facing many electricity markets is dealing with the increasing penetration of wind power and other intermittent generation. Several simulation studies have pointed to the advantages of trading closer to the time of delivery when large amounts of intermittent power are installed in an electricity system. Using two years of hourly data from Denmark and a simple linear probability model as well as a non-parametric technique, I show that an unexpected relationship exists between shortfalls and surpluses of wind power generation and the probability of trade on the Nordic hour-ahead market, Elbas. Shortfalls increase the probability of trade but surpluses are actually shown to decrease the probability of trade. This result is explained by Danish wind power policies that unintentionally discourages trading on short term markets and in turn likely results in unnecessarily high balancing costs.
Executive Summary
Short-term markets can save balancing costs with lots of wind power installed, if subsidies don’t get in the way
In the Nordic electricity market, along with several other markets around the world, much of the trade is organised a day ahead of delivery. But this can be problematic when large amounts of wind power are installed. The reason of course is that wind power can only be forecasted approximately and the predictions tend to get better closer to the time of delivery. The ability to trade on short-term markets should be advantageous in electricity systems with large amount of wind power.
Simulation studies have shown that trading closer to real time can save substantial amounts in balancing costs, yet little empirical work on the relationship between short-term trading and intermittent generation exists. Using Danish data I provide evidence that short-term markets, like the Nordic hour-ahead market Elbas, can serve a useful role in dealing with wind power forecasting errors. However I also show how subsidies and regulations can inadvertently get in the way of this market mechanism.
Figure 1 shows the expected relationship between wind power forecasting errors and the probability of trade on Elbas. Both positive and negative forecasting errors should lead to an increased probability of trade on the market. A producer with a shortfall of wind electricity will be more likely to go on the Elbas market to make up for the deficit in order to avoid added balancing costs. Likewise a producer with more wind power than they bid in the day-ahead market will wish to sell their surplus electricity.

Wind power subsidies likely lead to higher balancing costs
An analysis of data between 2010 and 2012 however shows an unexpected result. While shortfalls in wind power do indeed lead to a higher probability of trade on the short-term Elbas market, the opposite is the case for surpluses, as can be seen in Figure 2.
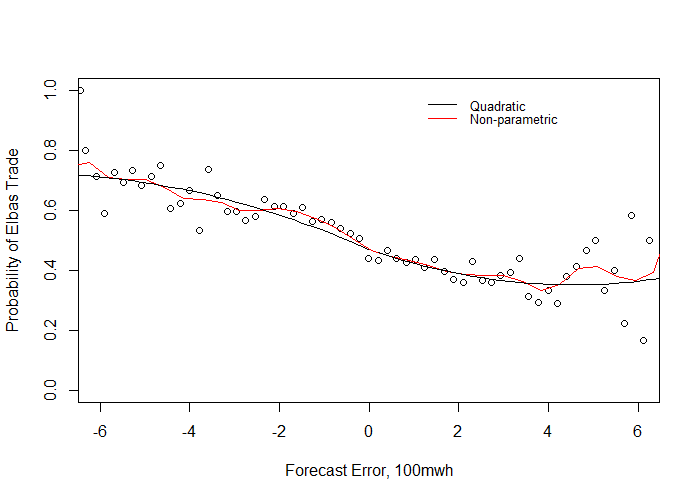
A likely explanation for this pattern is that Danish wind power owners can take advantage of a purchase guarantee that was part of a subsidy package that was phased out for turbines built after 2003. In other words turbine owners covered by the subsidy are guaranteed the day-ahead price plus subsidy for their wind power irrespective of what they had bid on the day-ahead market. In turn, they have little incentive to use the short-term markets when they have excess wind power production.
This explanation has a testable implication. A large jump in installations happened prior to the subsidy change in 2003, and more so, the purchase obligation expires after 10 years. We would then expect that the relationship between positive forecast errors and trade on the Elbas market to change around 2013 as a large portion of the turbines lose the subsidy. Updating the data and re-running the regressions for a set of rolling windows shows that as more data from late 2012 and 2013 is included, surpluses of wind power begin to increase rather than decrease the probability of trade on Elbas, as initially expected.
This research shows clear evidence that short-term markets can reduce the balancing costs associated with the introduction of large amounts of wind power. However, care must be taken so that subsidies that often accompany the introduction of such energy sources do not obstruct the incentives to use these short-term markets.
How electricity price spikes can help overcome the energy efficiency gap.
Econonomics Letters, Vol. 134, September 2015, Pages 114-117.
Data
R Code
Abstract
Studies have shown that many consumers and businesses fail to invest in energy efficiency improvements despite seemingly ample financial incentives to do so – the so-called energy efficiency gap. Attempts to explain this gap often focus on searching costs, information frictions and behavioral factors. Using data on Norwegian electricity prices and Google searches for heat pumps, I suggest that the inherently spikey nature of many deregulated electricity markets – often seen as a sign of inefficiency– has a strong and significant positive effect on searching for information on energy efficiency goods. I attempt to identify the informational/behavioral effect by using a novel method of measuring spikiness: decomposing the price series into a range of Loess smoothed series and deviations from these curves.
Executive Summary
An important and often contentious issue in energy market research has been what has been referred to as the energy efficiency gap. This is the phenomenon that both consumers and businesses do not seem to invest in energy efficiency despite seemingly ample returns to do so. Much of the recent litterature on the subject has focused on informational and behavioral factors. Information on energy efficiency may not be provided in optimal quantities since it has public-good qualities. In addition, behavioral factors may come into play. Even if a person has sufficient information on electricity prices and the availability of energy efficiency goods, the effort of calculating out costs and benefits requires attention and mental exertion.
This article attempts to connect the energy efficiency literature, especially its focus on information frictions and behavioral considerations, to characteristics of deregulated electricity market. In particular I argue that the tendency of deregulated electricity markets to experience occasional price spikes and high short-term volatility may have a silver lining. When price spikes happen, they can generate news coverage in newspapers, radio and television, providing information on electricity prices as well as a behavioral nudge to search for information on energy efficiency goods.
Searching costs and other informational frictions have been an active area of theoretical research in economics, however empirical work has been limited due to the difficulty of directly measuring these phenonomen. However, the widespread adoption of internet search engines has made observing searching behavior possible. I use data from Google, the leading search engine in Europe and North America, to study the relationship between electricity market price spikes and searches for energy efficiency goods.
I use the case of Norwegian wholesale electricity prices and searches for electric heat pumps. In Norway, heating is the largest single use of electricity by households. In turn, one of the most significant energy efficiency improvements a household can make is to switch from electric panel heaters to more efficient electric heat pumps.
A challenge is how to define price-spikes as opposed to normal price variation. I side-step this issue by creating measures of a range of “spikiness.” I take the difference between the actual price series and a smoothed series where the fit is varied. Spikiness is measured, on the one extreme, as brief deviations from a closely fitted curve to, at the other extreme, all deviations from an overall quadratic trend line.
I run regressions of searches for heat pumps on the range of the price-spike series. I control for weather as well as hydropower conditions. I also include a measure of smoothed prices that proxies for the actual price effect as most consumers pay retail prices that are based on monthly averages of wholesale prices. I find large positive and significant effects of positive price spikes for the full range of “spikiness.” Results are especially large at the narrowest definition of price spikes – representing large and short-lived price spikes that can be shown to generate the most media attention.
Real-time versus day-ahead market power in a hydro-based electricity market.
With Thomas Tangerås
Journal of Industrial Economics, Forthcoming.
Abstract
We analyse in a theoretical framework the link between real-time and day-ahead market performance in a hydro-based and imperfectly competitive wholesale electricity market. Theoretical predictions of the model are tested on data from the Nordic power exchange, Nord Pool Spot (NPS). We reject the hypothesis that prices at NPS were at their competitive levels throughout the period under examination. The empirical approach uses equilibrium prices and quantities and does not rely on bid data nor on estimation of demand or marginal cost functions.
The effect of oil prices on offshore production: evidence from the Norwegian Continental Shelf. Oxford Bulletin of Economics and Statistics, Volume 79, Issue 1, February 2017, pages 124-144.
Online appendix
R-code
Data
Abstract
I use detailed field-level data on Norwegian off-shore oil field production and a semi-parametric additive model to control for the production profile of fields to estimate the effect of oil prices on production. I find no significant evidence of a concurrent reaction of field production to oil prices, though a slight lagged effect is found of the magnitude of approximately 2 to 4\% for a 10 dollar per barrel increase in the real price of oil. Most of this effect appears to come in the planning phase of a field's development.
Executive Summary
For most of the last century, crude oil has been the world's single most important and valuable fuel source. Naturally, questions of how the oil price affects the world economy as well as how oil production reacts to the oil price have been fundamental topics in economics. However, given the importance of the topic, surprisingly little is known about how production reacts to the oil price at the field level. The few field-level studies that do exist, look at onshore fields. However, challenging offshore fields, which make up an increasing share of world oil production, are substantially different in character.
This gap in the literature can partly be explained by a dearth of detailed field level data. Another roadblock is the highly non-linear nature of the production data that results from the engineering and geo-physical forces involved in production from offshore wells. This data is not well modeled by standard linear econometric tools.
In this article I use detailed field-level data from the Norwegian Continental Shelf. To control for the non-linear production profile I use a semi-parametric model within the Generalized Additive Model frameworks. At a basic conceptual level, I use a smoothed function to control for the bell-shaped production curve that is common to most of the oil fields, using the remaining variation to estimate the coefficients on the concurrent oil price and its lags.
While a simple hotelling model would indicate that changes in oil prices should lead producers to dynamically optimize the timing of extraction, and in turn immediately alter production, my main results indicate that oil prices have no significant concurrent effect on oil production. A slight lagged effect is estimated at lags of between 1 to 4 years.
These results are consistent with an understanding of the offshore petroleum industry as having extremely high fixed and operating costs. Maintaining spare capacity in order to react to changes in the oil price is likely prohibitively expensive. Instead, increases in the oil price lead to more investment, which has an effect on production with a significant lag.
The findings in this paper can provide some guidance on the effects of the recent steep fall in the oil price on Norwegian production, as well as production from other offshore areas. The results indicate that the recent fall in prices is unlikely to have major ramifications for production in existing fields. Anecdotal evidence however suggests that searching and exploration are being curtailed, thus the effects on total future production could be significant by way of fewer new field developments.
Finally, the modest estimated effect of prices on production adds weight to the argument of James Hamilton that most of the increased supply of oil that comes from higher prices is from expanding the geographic and technological boundaries of oil production. For example exploration of deep-water oil deposits off the coast of Brazil and extraction of oil sands in western Canada.
Cost, Contractors and Scale: An Empirical Analysis of the California Solar Market.
The Energy Journal, Vol. 38, No. 6
Data Set
Abstract
I present an empirical analysis of the rapidly growing California rooftop solar photovoltaic market using detailed data of over 100,000 solar installations between 2007 and 2014. The rapid fall in the cost of solar panels stand central in the expansion of this market. I use a semi-parametric regression model to aid identification of cost factors by decomposing time-varying and cross-sectional components. I find that the use of Chinese manufactured panels are associated with costs that are 6% lower. Economies of scale at the local level (number of yearly installations in a zip code) and at the installation level (size of the installation) are also associated with lower costs. Higher subsidies, and higher contractor market-share are associated with higher costs. I use an exploratory analysis of the dominant contractor, SolarCity, to discuss non-cost factors in the expansion of the solar photovoltaic market.
Executive Summary
The market for rooftop solar has expanded rapidly over the last decade as costs have fallen. In turn solar photovoltaic power has become a viable energy alternative. The rapid fall in solar panel costs has made rooftop solar panel systems profitable for many homeowners and businesses in California and elsewhere. The growth of rooftop solar has implications for electricity market structure and stability, grid infrastructure and operations, and climate change policy. Understanding the drivers of this market becomes an important research objective.
Investment costs in photovoltaics vary greatly and identifying the sources of cost variance is important in understanding the expanding rooftop solar panel market. Global factors such as manufacturing economies of scale and technological change affect costs over time. The distributed nature of photovoltaics also means that local factors affect costs across geographies, demographics, and the structure and strategies of contractors.
However, empirically decomposing the variation in solar costs can be problematic. The global causes of cost variation over time tend to be unobserved and non-linear. At the same time, local observable variables of interest — like the effect of using Chinese panels, installation economies of scale, and cost-inflationary effects of subsidies — can be expected to be correlated with the cost trends over time. A failure to properly control for the non-linear trend will tend to bias the estimated coefficients on the included observed variables.
To decompose the variation in costs and help identify the role of the observable local factors, I use a semi-parametric model. I use a cubic regression spline to account for the general non-parametric shape of the fall of prices over time, while allowing the observable variables to enter the equation linearly.
I find that the use of panels from Chinese manufacturers are associated with costs that are 6% lower. Additionally, I find evidence of local economies of scale. On average an additional 10 MW of capacity installed in a certain year in a given zip code is associated with solar photovoltaic systems that are between 13% and 35% less costly. Evidence is also found for subsidies having an inflationary effect on costs. A $100 increase in subsidies per KW of capacity is associated with an increase in costs of approximately 1%.
The time period studied was characterized by increasing concentration in the photovoltaic contractor market. However, this trend does not appear to be driven by costs. In fact, contractors with higher market shares are associated with having slightly higher costs. In an extended discussion and case study, I explore non-cost explanations for both increasing concentration in the contractor market as well as for the expansion of the solar photovoltaic market as a whole.
I suggest that the introduction of leasing played a pivotal role. Leasing loosened consumer financing constraints by switching ownership to large contractors with access to multiple sources of financing. Transferring ownership to large contractors may also have allayed concerns about both the complexity of maintaining a solar photovoltaic installation as well concerns about the quality of components.
Exploring solar public policy is not the primary objective of this article, but several implications from the research do emerge. A direct policy implication concerns the design of flexible subsidies. In some US states only homeowners who themselves own the solar system on their roof can collect government production subsidies. On the other hand, the flexibility of California's rules allowed for the introduction of leasing models, which likely helped to expand the market.
Trade policy is also indirectly related to the subject of this article. In 2014, after the period studied, tariffs of at least 30 percent were imposed by the US Department of Commerce on Chinese and Taiwanese solar panels. A full analysis of the merits and fairness of these sanctions is beyond the scope of this article. However, this article clearly shows how competition from Chinese manufacturers helped drive down overall system costs and spurred increased installations. Subsidizing solar systems while at the same time imposing tariffs on imported panels seem like contradictory actions if the aim is to increase renewable energy production.
Are Solar Panels Commodities? Evidence of Quality Differences and Asymmetric Information from California
European Journal of Operational Research, Vol. 38, No. 6
Abstract
Solar panels should not be considered commodities. Considerable quality differences, as measured directly by degradation of production over time, are found between manufacturers. This has implications for pricing and competition in the market for solar panel systems. I test two implications from the theory of asymmetric information of quality and find: 1.) Solar power systems with high-information third-party owners display higher quality than host-owned systems. 2.) Furthermore, with a 85% probability, the price of solar panels that are owned by high-information owners are more highly correlated to quality. I use random ef- fects models estimated by maximum likelihood and hierarchical models estimated by Bayesian Markov Chain Monte-Carlo.
The Other Renewable: Hydropower Upgrades and Renewable Portfolio Standards
The Energy Journal, Vol. 39, No. 2
Data
Abstract
A total of 29 U.S. states and the District of Columbia have in place mandatory Renewable Portfolio Standards (RPS) which require that a minimum amount of energy come from renewable resources. We investigate the role of hydropower vis-a-vis other renewables under RPS. Using a Bayesian multilevel model, we find that hydropower plants subject to RPS are more likely to plan upgrades. These planned upgrades appear to be a substitute for solar and wind rather than complementary reserve generation.
Executive Summary
Renewable Portfolio Standards (RPS), that require that a minimum amount of energy come from renewable resources, have been one of the main policy instruments for encouraging renewable energy investment in the United States. By several accounts, these policies have been found to be effective in promoting wind and solar power generation. However, an analysis of the effect that these policies have had on hydropower investment is missing from the literature.
Hydropower is both renewable and, in some cases, dispatchable. Hence hydropower has the potential to help states meet their RPS goals while overcoming the intermittency problem associated with solar and wind power. Because of environmental restrictions and the exhaustion of potential sites, investments in new capacity are limited. However, as the Department of Energy points out , significant gains in capacity and efficiency can be made by refurbishing existing hydropower plants.
We study the decision of hydropower plant owners to invest in existing plants. We estimate that RPS rules have a significant positive effect on the probability of a planned upgrade.
Given that hydropower can be both a substitute for solar and wind power as well as a complimentary source of balancing generation, it is not ex-ante clear what the relationship is between planned investments in hydropower and existing capacity in wind and solar capacity. Our results indicate that planned hydropower upgrades serve as a substitute for wind and solar power under RPS. Hydropower investments tend to be a way of fulfilling RPS requirements instead of solar and wind power, rather than as a complimentary form of balancing power.
A major methodological problem in working with data from the entire continental United States is accounting for the unobserved geographic variables that may bias the estimation. Geographic fixed effects could be used to control for this variation, and a variable indicating a plant’s transmission system owner is available. However, the inclusion of these 230 fixed effects may lead to an overfitting of the data as well as absorbing of all the variation needed to estimate the policy effect of RPS. Instead, we have used a Bayesian multilevel model that allows us to model both the geographic diversity of our data as well as the policy effect of RPS, while avoiding overfitting.
Keywords Renewable portfolio standards, Hydropower, Bayesian methods, Multilevel models, Planned investment. Planned investment.nned investment.
Will the locals benefit? The effect of wind power investments on rural wages
Working paper, Revise and resubmit, Energy Policy
Abstract
An important and poorly understood question when communities consider wind power investments is whether the local population will benefit financially. I examine the effect of wind power investment on wages in rural counties in the US. I combine quarterly panel data on wages with data on all wind power plant investments larger than 1 megawatt (MW). Using a Bayesian multilevel model estimated by MCMC, I estimate a significant positive effect, with a magnitude consistent with a 2\% permanent increase in wages following an investment in a large wind farm of 400 MW. however, this effect has large geographic and socio-economic variation. Counties with low employment tend to see little impact on wages from wind power, potentially because slack in the labor market prevents wages from rising. The findings have implications for energy policy and planning.